
Case studies
Examples of our work, without client names
Three real projects from the field. We do not disclose client names to respect confidentiality, but we describe the problem, the approach, and the outcome as they were.
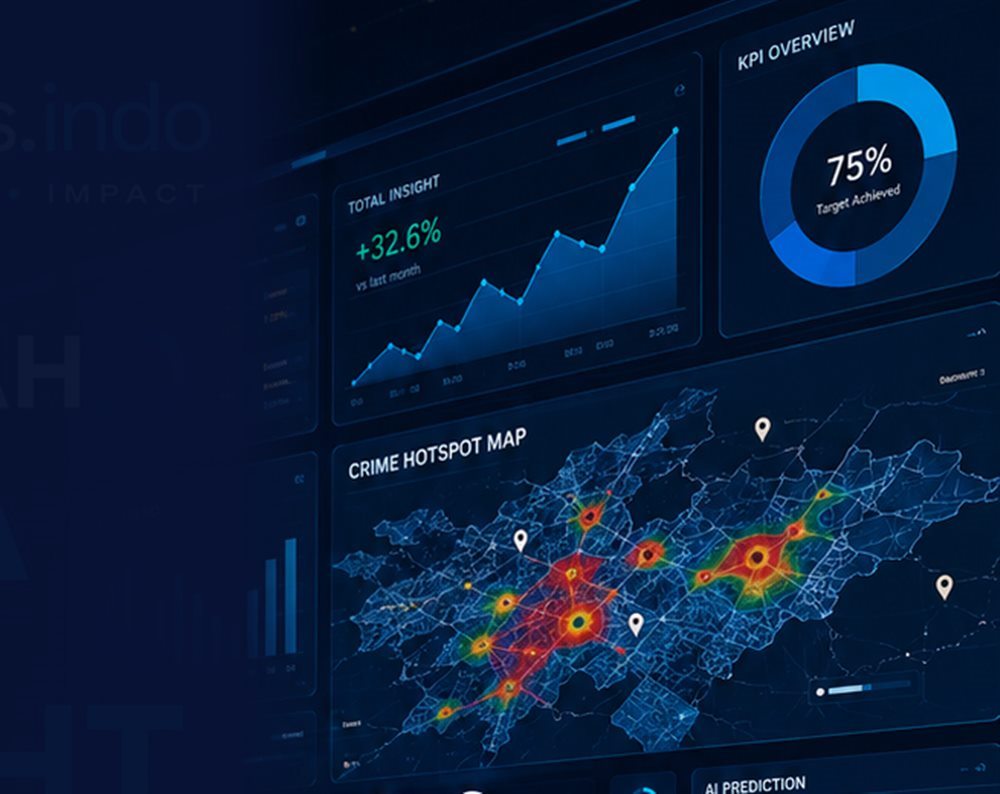
A 21-page operational dashboard for six regions
The problem
Performance across six operating regions was tracked through reports compiled manually from many sources. Figures often differed between versions, and regional leaders waited a long time for a complete picture.
The outcome
The dashboard was presented to all regional directors and is used to monitor performance across the six regions regularly, from a single source of figures.
What we did
- Worked with stakeholders in each region to identify the indicators actually used for decision-making.
- Built an integrated data model with agreed calculation rules for each indicator.
- Developed a 21-page Power BI dashboard, from an executive summary to regional detail.
- Led a 10-person team with daily tracking and weekly client meetings.
“The dashboard that gets used is not the one with the most charts, but the one that answers next week’s meeting questions.”
Supplier performance analytics from three data sources
The problem
Supplier data was scattered across SAP, Oracle, and dozens of Excel files. The team had no quick way to see which suppliers had issues requiring follow-up.
The outcome
The team can assess supplier performance and spot issues requiring follow-up in one view, without manually combining files.
What we did
- Gathered requirements from 8 stakeholders and documented them in a BI specification.
- Integrated data from SAP, Oracle, and Excel into a single data model.
- Built a 17-page dashboard with supplier performance scores, trends, and a list of issues requiring follow-up.
- Ran user acceptance testing (UAT) with 20+ end users.
“Clean data integration matters more than a flashy interface.”
An employee satisfaction and engagement survey of 300+ staff
The problem
Management wanted to understand what actually drives employee satisfaction and engagement, not just the average satisfaction score.
The outcome
The recommendations were translated into five new HR initiatives implemented by the company.
What we did
- Designed the survey methodology and questionnaire, and led a team of 4 researchers to reach 300+ employees.
- Assessed the validity and reliability of the instrument.
- Ran a driver analysis to identify the factors with the strongest influence on satisfaction and engagement.
- Presented findings and recommendations to the Board of Directors and Board of Commissioners.
“An average tells you where you are. A driver analysis tells you where to start.”
Facing a similar challenge?
Tell us about your project, and we’ll work with you to find the right solution.
Prefer email? Write to admin@datalyticsindo.com